Global Happiness:
A Look into How Different Countries Rank Their Happiness and What Contributes to Those Scores

Happiness is a species wide phenomenon that can be highly subjective, based on cultural constructs all the way down to personal beliefs; at its core, however, happiness may be more predictable. In what is becoming an annual tradition, the United Nations releases their World Happiness Report in an attempt to raise global awareness of happiness and what may influence it. The data comes from the Gallup World Poll, where participants are asked to rate their overall happiness from 0, being the worst they could imagine feeling, to 10, being the happiest they can imagine. They are then asked to rate six different characteristics that they feel contribute to their happiness score. Those characteristics include: economy (GDP per capita), social/family support, overall health and life expectancy, freedom of choice, trust in their government or perceptions of governmental corruption, and the generosity they experience.
I gathered the data published for the years 2015 to 2019 and formed a few base questions to kick start my explorations: what are the top ten happiest countries by year? What are the top ten unhappiest countries by year? Using the given data, are there any specific indicators of a country’s overall happiness score? From these questions I then hypothesized that all six characteristics would show at least a slight positive correlation with the happiness score, with the highest positive correlation seen between social support and happiness score as well as health and happiness score, and the lowest positive correlation seen between generosity and happiness score.
Ten Happiest Countries by Year
According to the data, the ten happiest countries by year were:
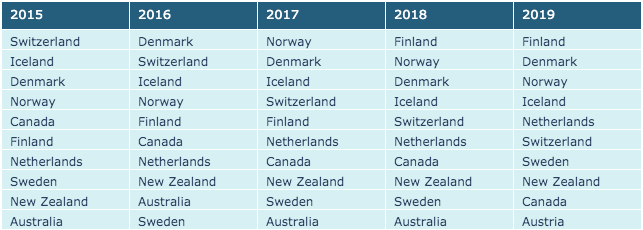
It’s interesting to note the consistency found within the top ten happiest country list over the last five years, with the majority of the listed countries appearing almost every year.
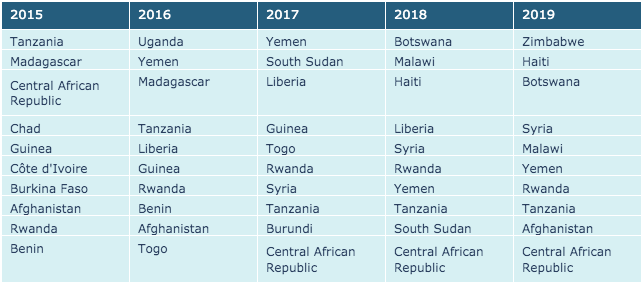
Ten Unhappiest Countries by Year
According to the data, the ten unhappiest countriest by year were:
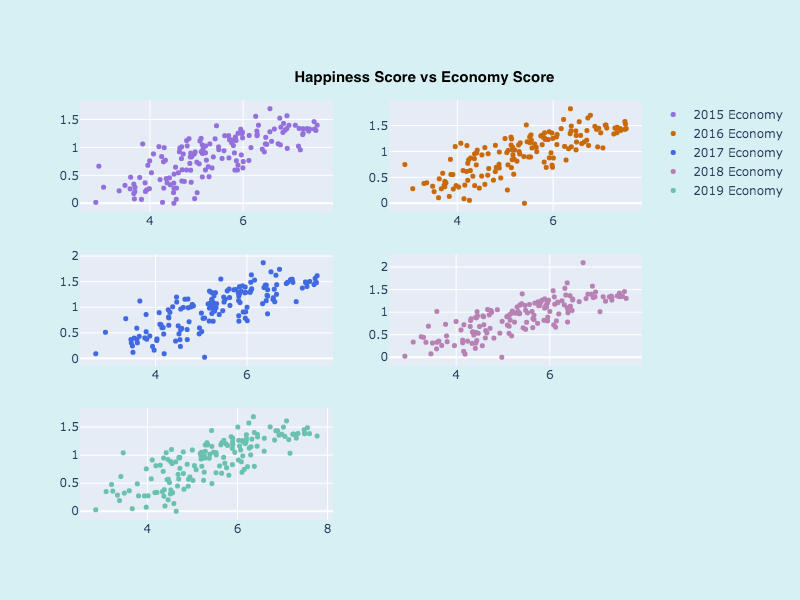
Correlations With the Six Categories
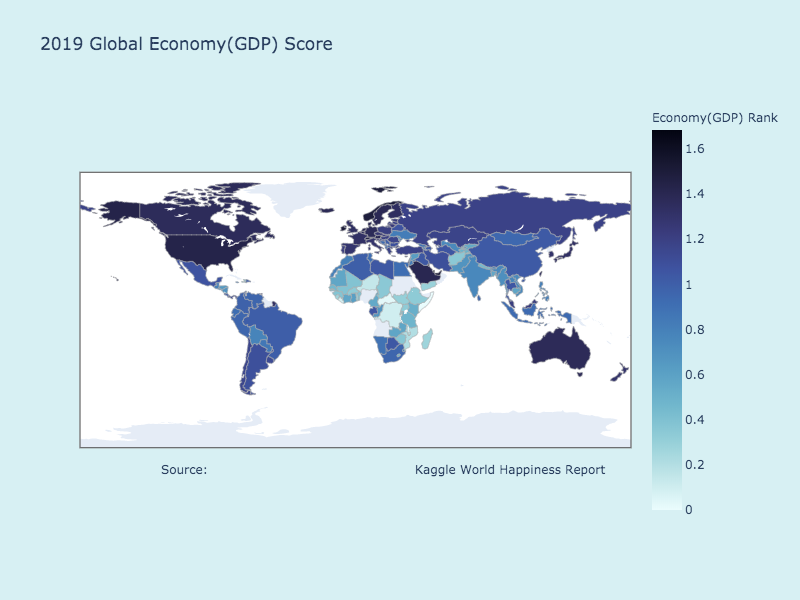
For each given year, from 2015-2019, there appears to be a strong positive correlation between the happiness score and a country’s economy or GDP per capita.
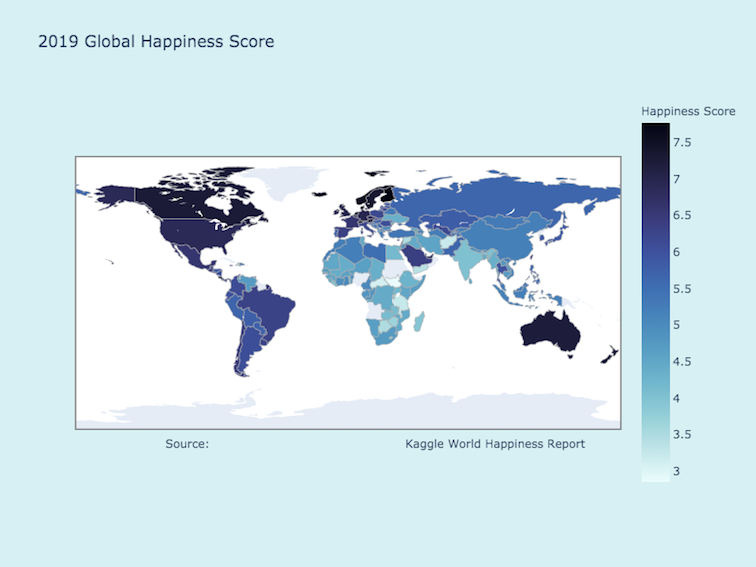
We can see this correlation clearly on a pair of maps as well, with the first map showing the greatest happiness scores in darker shades and the second map showing the greatest impact individuals feel their economy has on their happiness score also in darker shades. This tells us that the happiest countries tend to view their econmy/gdp per capita as one of the highest contributors to their happiness score, .
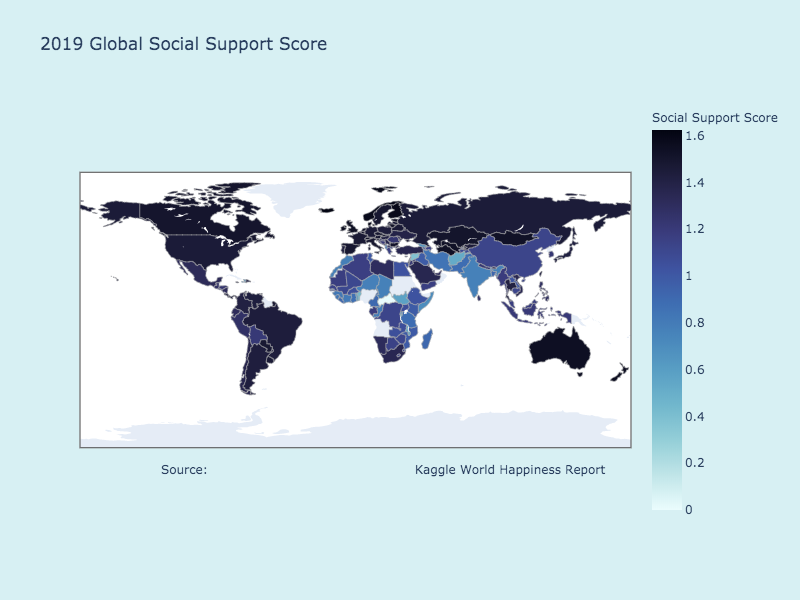
We also see a strong positive correlation between the happiness score and the social or family support available:
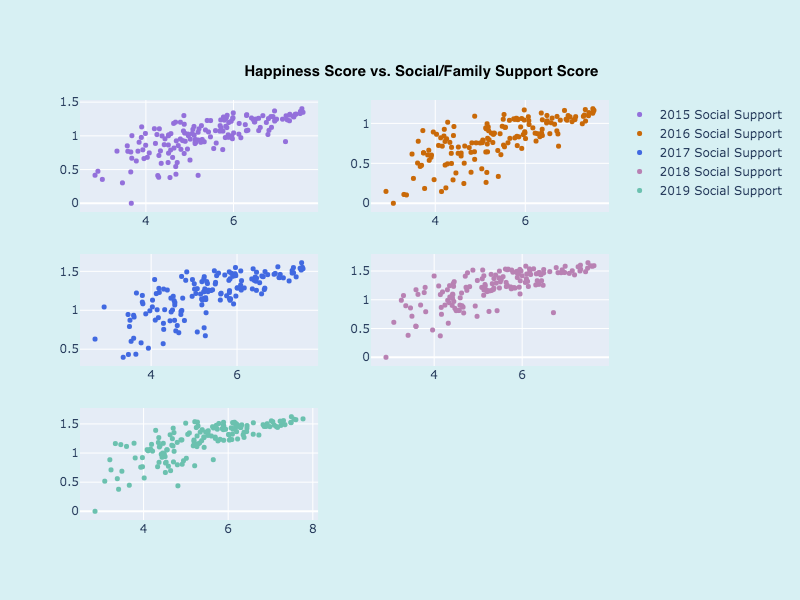
Of note here is that most countries scored social/family support relatively equally as a contributing factor to their happiness globally; this tells us that for many countries, the level and importance of social and family support that they receive is perceived very similarly world wide, and may not necessarily be an indicator of higher happiness scores.
And lastly we see a strong positive correlation between the happiness score and a country’s overall health and life expectancy:
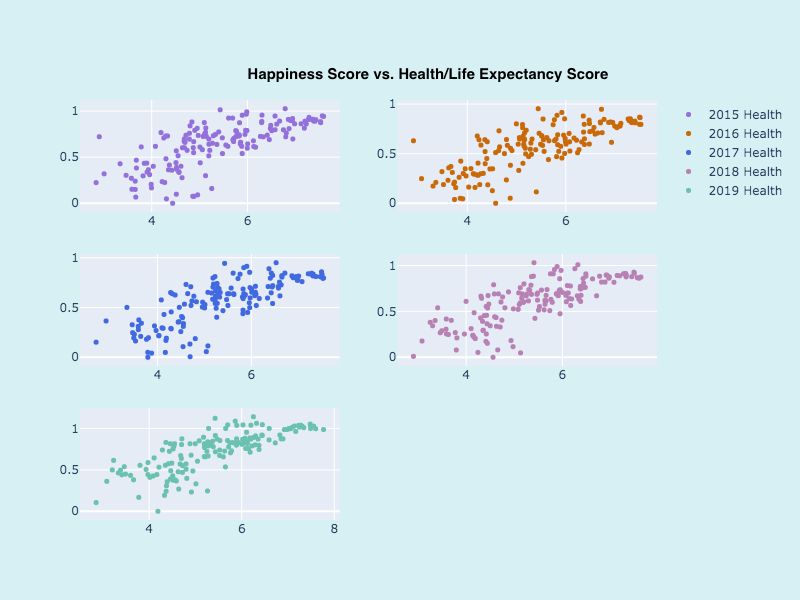
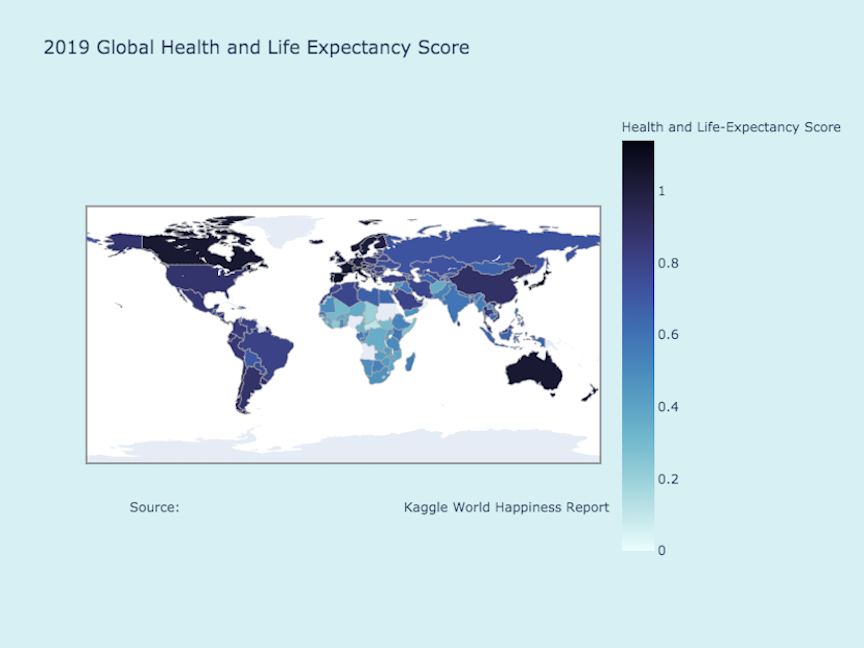
I also found slight positive correlations between happiness score and both perceptions of freedom and government trust, as hypothesized. Lastly, when comparing the happiness score with a country’s generosity, it appears to have little to no correlation at all; this went against my hypothesis that there would be a small positive correlation between the two.
Conclusion
From this data we can conclude that at a global level the the happiest countries tend to attribute that given country’s economy or GDP per capita, the level in which individuals feel they receive social or family support, and that given country’s overall health and life expectancy as the three most important factors contributing to overall happiness scores. This becomes even more apparent as we compare the happiness scores of the top ten happiest countries with the top ten countries in each of the six categories. Further research could include gathering and describing the actual levels of each category by country to determine actual impact.